
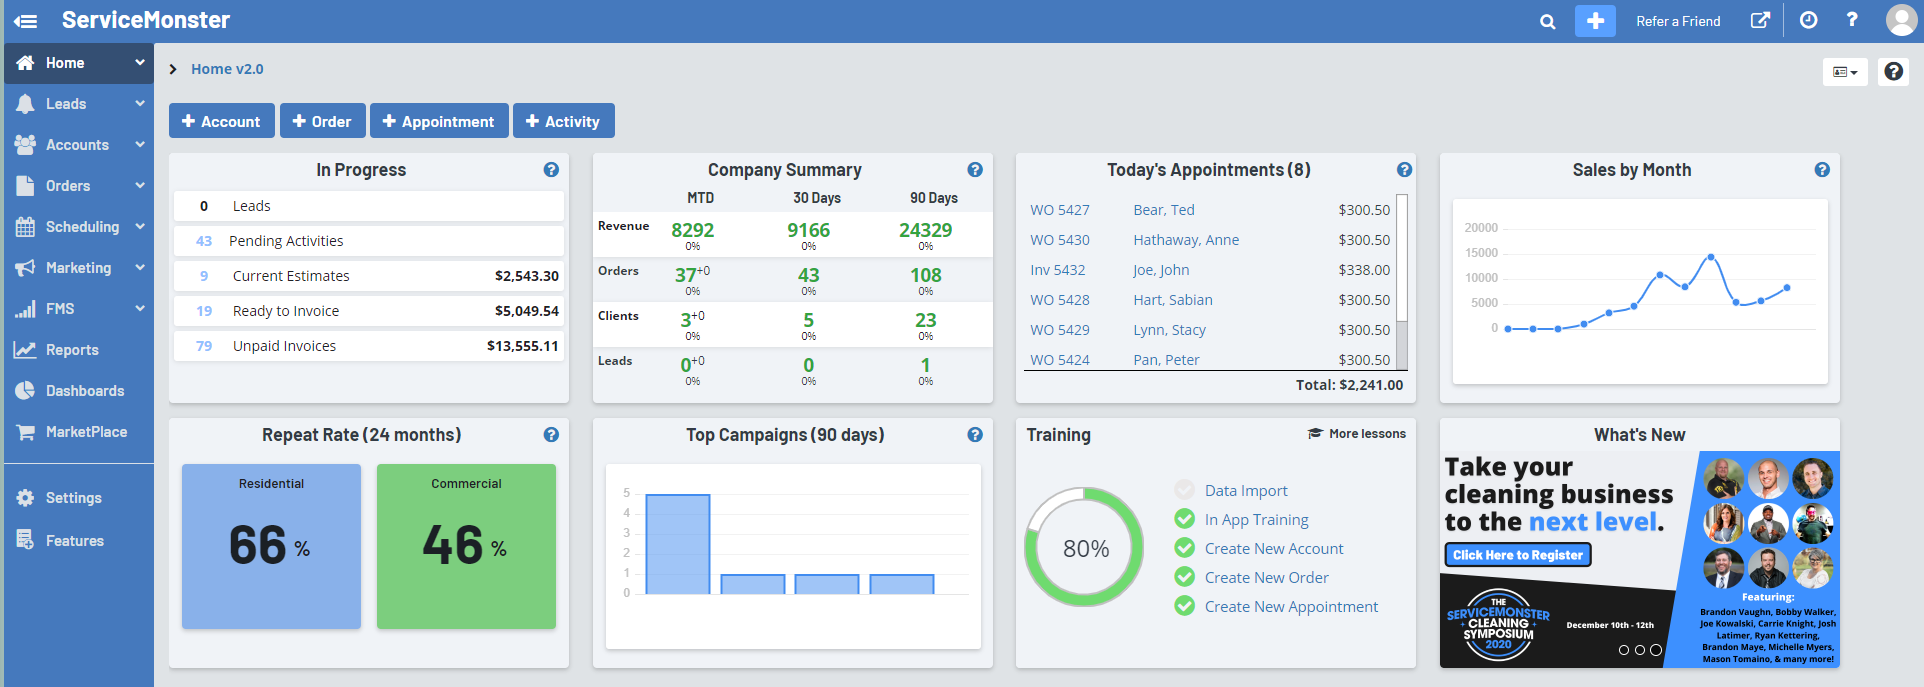
New Account, Order, Appointment, and Activity

+ Account: Click here to easily and quickly create a new account.
+ Order: Click here to quickly create a new order. This takes you to the new order page.
+ Appointment: Click here to go to the schedule to add in a new appointment.
Home View

This button allows you to change which home page view you can see, you can choose between Home v2.0, Home v1.1, and Home v1.0
Dashboards
In Progress
Shows you a list of important, in-progress tasks.
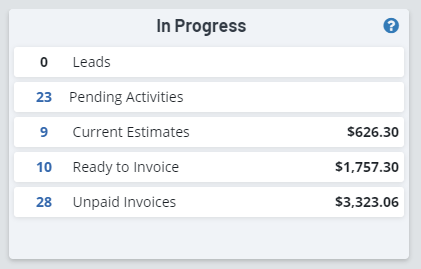
Leads: shows a count of all new leads in the system. New leads are leads entered in the last 30 days, declined leads are not included.
Pending Activities: count of pending activities still awaiting completion
Current Estimates: count of estimates created in the last 60 days. Also shows the total of these estimates to show you potential revenue if all estimates are converted
Ready to Invoice: work orders that had a scheduled appointment that is now in the past and no further appointments are scheduled in the future. Because invoicing is such a critical step in your workflow, this section helps you identify any orders that are either ready to be invoiced the order was canceled/postponed and not properly removed from the schedule. Also shows the total of these orders to show you potential revenue
Unpaid Invoices: invoices that are still awaiting payment. Also shows the total accounts receivable remaining to be collected
Company Summary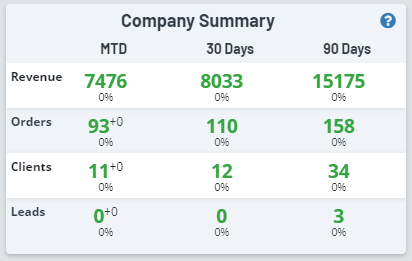
Revenue
The large number indicates $ amount for each time period (month to date, last 30 days, last 90 days), with Green = growth, red = decline.
Smaller % indicates how large of an increase or decrease occurred.
Orders
The large number indicates the number of orders for each time period (month to date, last 30 days, last 90) with Green = growth, red = decline, and the smaller superscript number is the count of new orders from year over year comparison (in each time period).
% indicates the rate of change from year over year comparison in each time period (again green = growth, red = decline).
Clients
The large number indicates the count of new accounts added for each time period (month to date, last 30 days, last 90 days), with Green = growth, red = decline, and Smaller superscript number = count of new accounts from year over year comparison (in each time period).
% indicates the rate of change from year over year comparison in each time period (again green = growth, red = decline).
Leads
The large number indicates the count of new leads added for each time period (month to date, last 30 days, last 90 days), with Green = growth, red = decline, and Smaller superscript number = count of new leads from year over year comparison (in each time period).
% indicates the rate of change from year over year comparison in each time period (again green = growth, red = decline).
Today's Appointments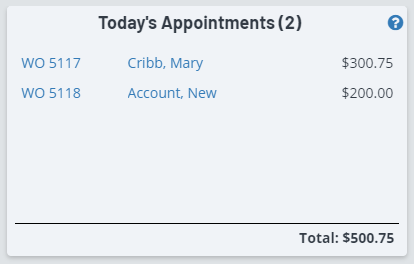
Column 1: Shows the order type and order number that each appointment is tied to. Clicking this will navigate you to the order page.
Column 2: Shows the account name for each appointment. Clicking this will navigate you to the account page.
Column 3: Shows the order total.
Sales By MonthA standard line chart showing revenue totals for the last 12 months.
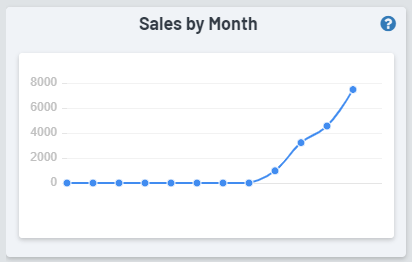
Y-axis (left): Revenue total ($)
X-axis (bottom): Month
Hovering over any of the data points will show you the exact revenue total for that month. Hovering between two data points will show you the exact revenue data for both months simultaneously.
Frequently Asked Questions:
How is revenue calculated?
Revenue will only show here if the order itself has been turned into an invoice. This signals to the system that the order has been completed
How does the system determine which month the revenue was counted?
The date is determined by when the work itself was completed (accrual-based). The “Date Completed” on the order itself is what determines that timestamp.
Check out the completion wizard for a handy way to ensure both of these steps are handled as work is completed.
Repeat Rate (24 Months)Shows the number of customers that you have serviced multiple times in a two-year period, with a Residential and Commercial breakdown. In many industries, this two-year window helps identify whether you “retained” the customer or not.
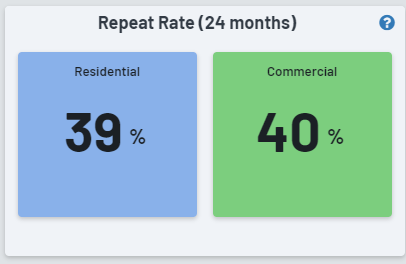
As mentioned above, Residential (blue) and Commercial (green) clients are separated out, the larger number shows the % of your active customers that have repeat business. “Active customers” in this case refers to active residential customers or active commercial customers depending on which you are viewing, hovering over this number shows you the count of repeat clients.
The smaller number below shows growth (green) or decline (red) of repeat customers since the previous time period. If no number is visible that means there is no data yet to compare against.
Top Campaigns (90 Days)
Shows top-performing campaigns in a rolling 90 day period.
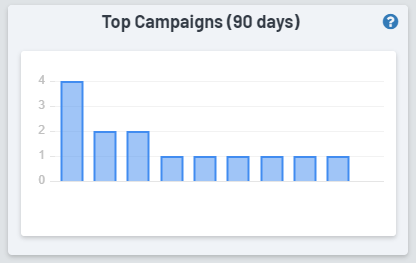
Y-axis (left): Number of conversions
X-axis (bottom): Lead Source/Campaign name
Frequently Asked Questions:
What is a “lead source” and what’s the difference between that and a “campaign?”
Lead sources are simply identifying which marketing efforts brought in a customer (or repeat order). For all intents and purposes, lead sources and campaigns are identical when comparing results. However, since we use the term “campaign” for our internal marketing efforts and you may as well, we wanted to ensure there was no confusion.
What is a “conversion?”
When an order is invoiced with said lead source attached.
How can I improve campaign results?
Check out this podcast with some great tips!
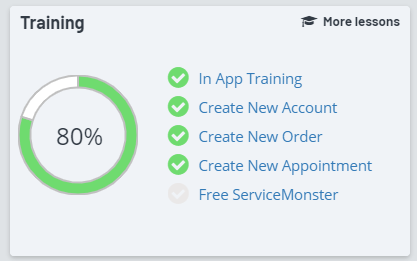
TrainingThis box shows a few of our in-app training videos. Simply click on the name of the training to go through it, or click on the "More Lessons" link to view all the lessons we offer at this time.
What's New?
Here you can see the latest blog posts and information from the ServiceMonster team!

Frequently Asked Questions:
Why does it total my estimates along with work orders and invoices?
This dashboard is not intended to be used for expected daily cash flow. Instead, the goal is to give you easy access to a list of your clients that are being serviced today so you can easily make edits as needed and keep up with your technicians' workload.
How is this organized?
Alphabetically by route. So if you have a route named “Adam” and a route named “Joe,” then Adam’s appointments will show first in chronological order, and then Joe’s appointments will follow.