Company Summary
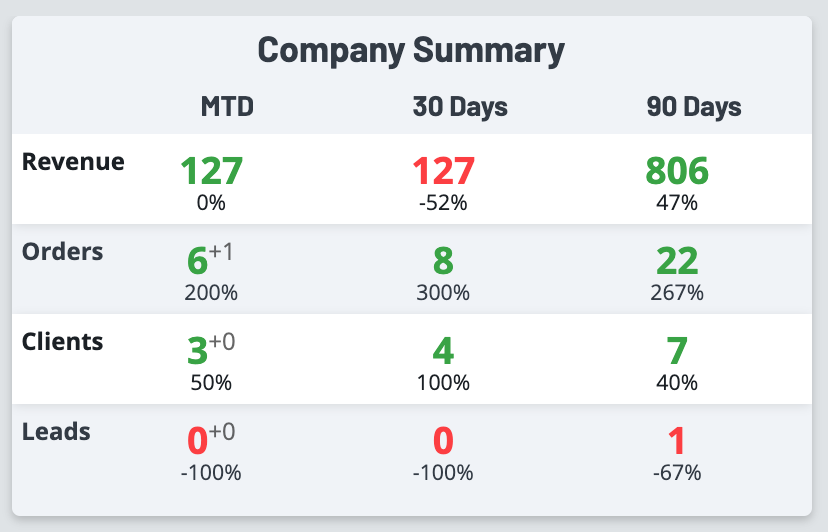
A quick overview of how your company is progressing, located on the home page.
The Company Summary dashboard is so you can track your growth (or lack of) based on the month to date (MTD), last 30 day window, or last 90 day window.

Revenue:
- Large number indicates $ amount for invoices with a completed date in each time period (month to date, last 30 days, last 90 days)
- For each record, a green number indicates growth while a red number indicates decline (year-over-year comparison)
- Smaller % indicates how large of an increase or decrease occurred
- Tooltip (hover over number to show) shows year-over-year comparison for $ amount of invoices with a completed date in each time period (month to date, last 30 days, last 90 days)
Orders:
- Large number indicates count of orders (of any order type) with a created date in each time period (month to date, last 30 days, last 90)
- For each record, a green number indicates growth while a red number indicates decline (year-over-year comparison)
- Smaller superscript number = count of new orders (of any order type) created today
- % indicates the rate of change from year-over-year comparison in each time period (again green = growth, red = decline)
- Tooltip shows year-over-year comparison for the count of orders with a created date in each time period (month to date, last 30 days, last 90 days)
Clients:
- Large number indicates count of new accounts added for each time period (month to date, last 30 days, last 90 days)
- For each record, a green number indicates growth while a red number indicates decline (year-over-year comparison)
- Smaller superscript number = count of new accounts added today
- % indicates the rate of change from year over year comparison in each time period (again green = growth, red = decline)
- Tooltip shows year-over-year comparison for the count of new accounts with a created date in each time period (month to date, last 30 days, last 90 days)
Leads:
- Large number indicates count of new leads added for each time period (month to date, last 30 days, last 90 days)
- For each record, a green number indicates growth while a red number indicates decline (year-over-year comparison)
- Smaller superscript number = count of new leads added today
- % indicates the rate of change from year-over-year comparison in each time period (again green = growth, red = decline)
- Tooltip shows year-over-year comparison for the count of new leads with a created date in each time period (month to date, last 30 days, last 90 days)
