
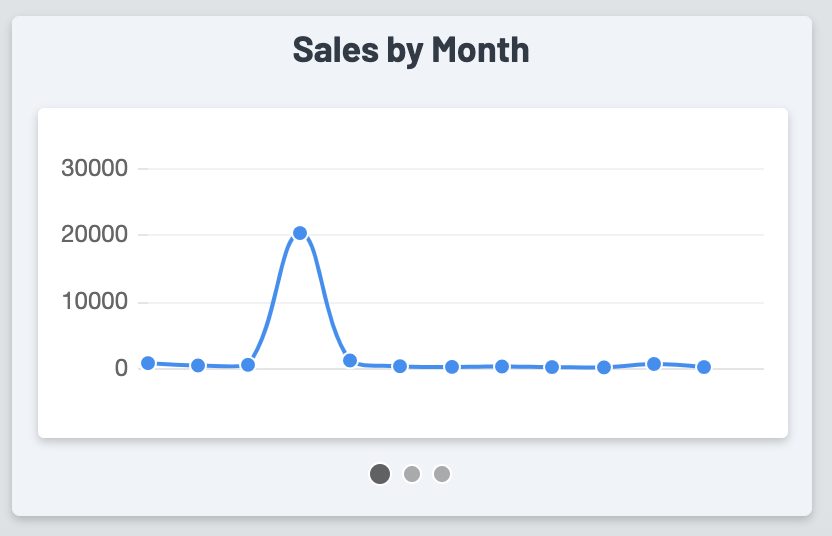
- Y-axis (left)= Revenue total ($)
- X-axis (bottom) = Month
- Hovering over any of the data points will show you an exact revenue total for that month. Hovering between two data points will show you exact revenue data for both months simultaneously.
Frequently Asked Questions:
- How is revenue calculated? Revenue will only show here if the order itself has been turned into an invoice. This signals to the system that the order has been completed
- How does the system determine which month the revenue was counted? The date is determined by when the work itself was completed (accrual based). The "Date Completed" on the order itself is what determines that time stamp.
Check out the completion wizard for a handy way to ensure both of these steps are handled as work is completed.