
As there are several Dashboards available to you, click a link below to jump to that particular section:
You can also choose to filter using the drop-down menu if you are looking at the Current Month (MTD), Current Year (YTD), Last Month, Last 30, Last 90, Last 365, Last 2 Years, Last 3 Years, or Last Four Years, and if you are comparing that to the Previous Period or Previous Year.
Sales
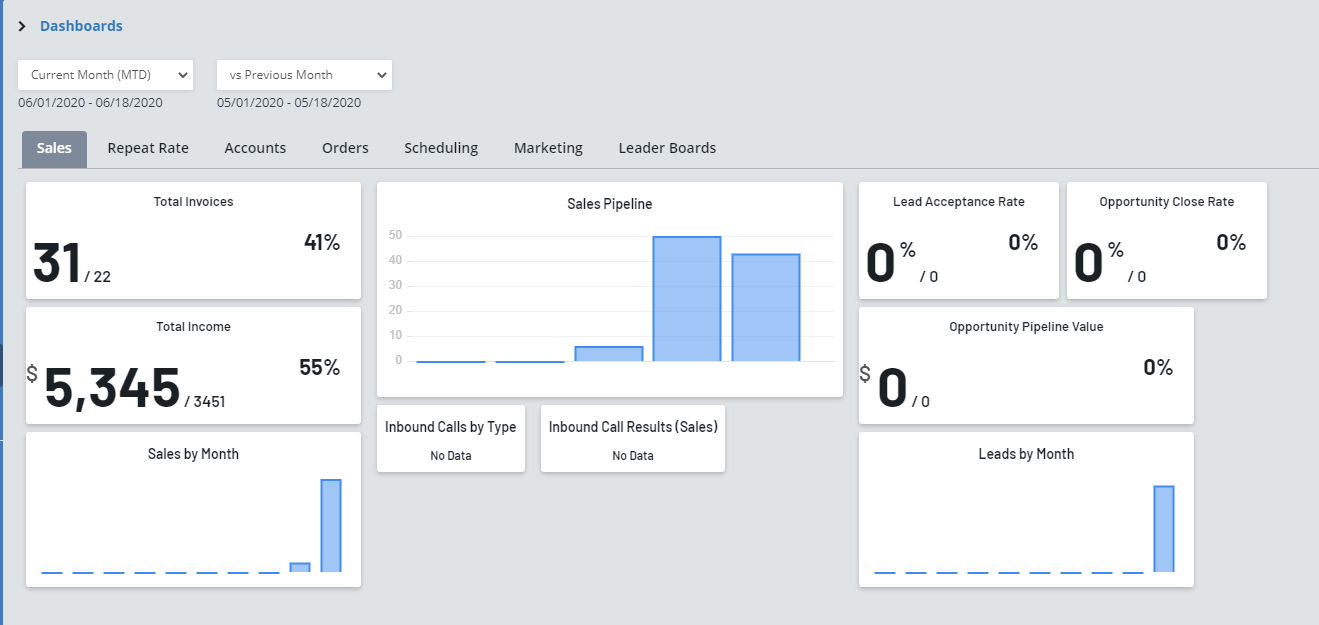
Total Invoices: Comparing the total invoices between both time periods, and your percentage growth.
Total Income: Comparing the total incomes and percentage growth.
Sales by Month: A bar graph chart comparing sales (Y-Axis) by month (X-Axis).
Sales Pipeline: A bar graph which shows what steps your orders are at. The Y-Axis is thenumber of orders, and the X-Axis is the order type (Leads, Opportunities, Estimates, Work Orders, Invoices)
Inbound Calls by Type: Information about your call activities.
Inbound Call Results (Sales): How many inbound call activities turn into the creation of orders or invoices.
Lead Acceptance Rate: The rate that you accept leads.
Opportunity Close Rate: The rate that you close opportunities.
Opportunity Pipeline Value: The value of your opportunities compared to the last period.
Leads by Month: How many leads you have a month in bar graph form. Y-Axis is the number of leads, and X-Axis is months.
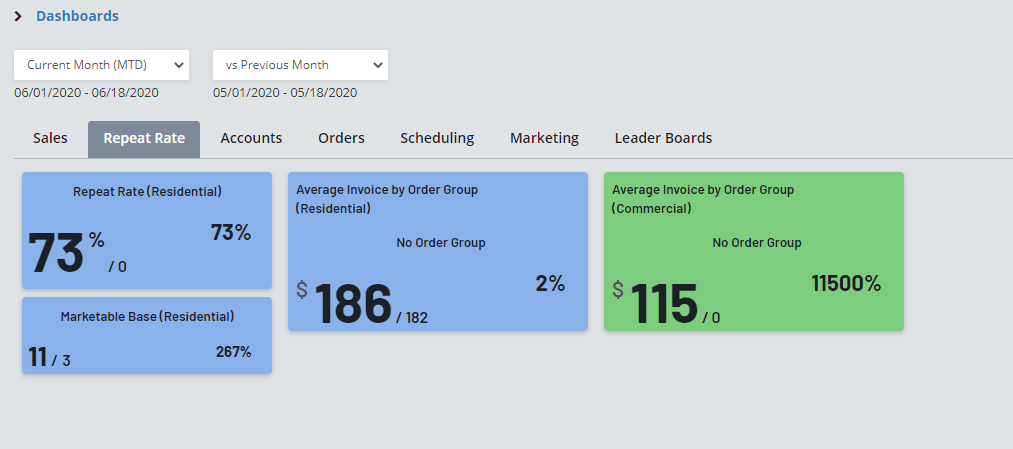
Repeat Rate (Residential): Your repeat rate for residential accounts, and percentage growth.
Marketable Base (Residential): Your number of marketable accounts compared to last period.
Average Invoice by Order Group (Residential): The average invoice by order grouping.
Average Invoice by Order Group (Commercials): The average invoice by order grouping.
Accounts
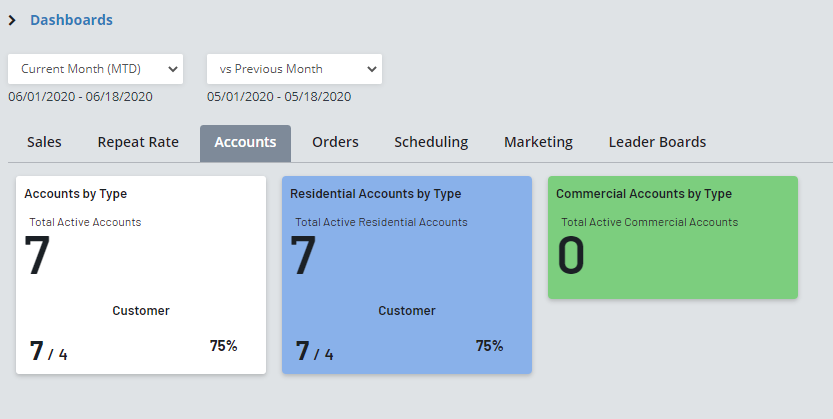
Accounts by Type: Number of accounts you have by type.
Residential Accounts by Type: Number of residential accounts by account type.
Commercial Accounts by Type: Number of commercial accounts by account type.
Orders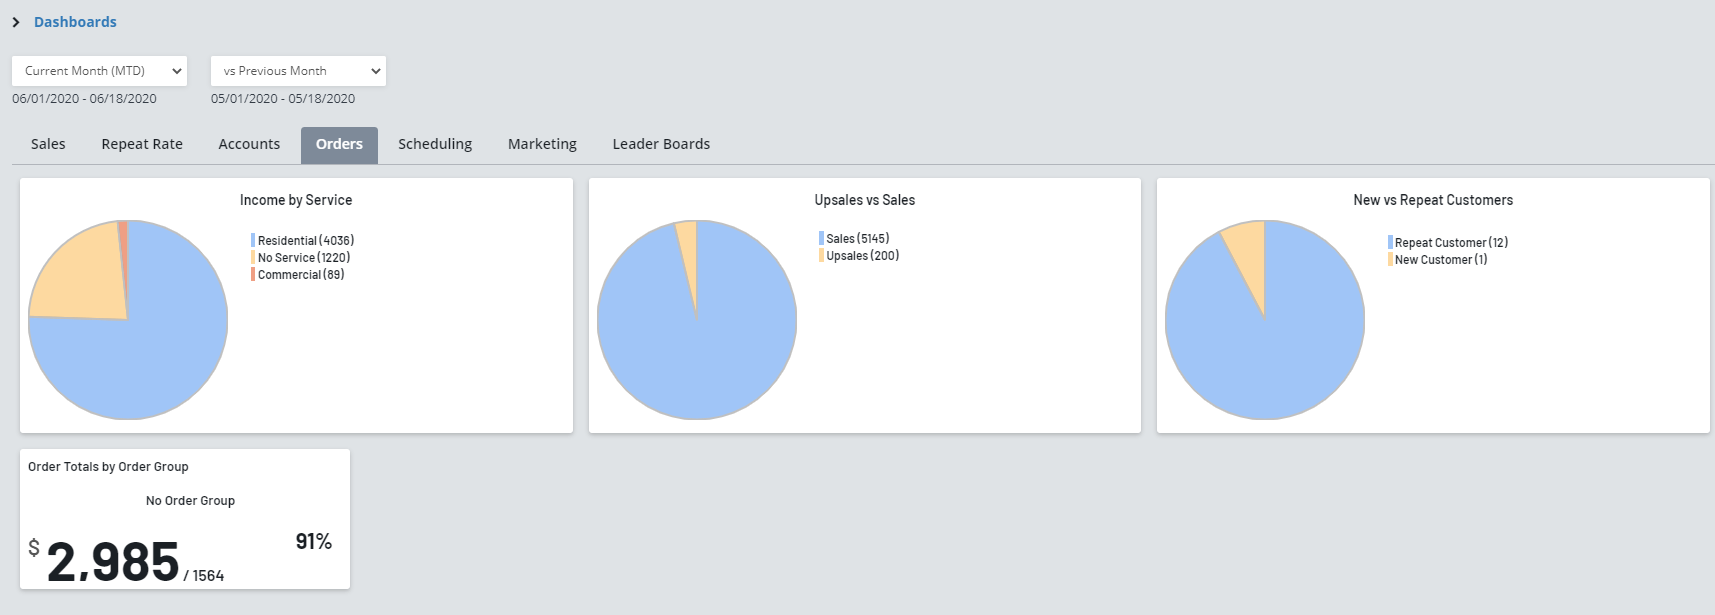
Income by Service: A pie chart which is divided up by your invoice from Residential Services, Commercial Services, or No Service.
Upsale vs. Sales: A pie chart which groups your income for the period by sales and upsales.
New vs Repeat Customers: A pie chart which groups your income for the period by repeat or new customers.
Order Totals by Order Group: Here you can see the total revenue on orders by order group.
Scheduling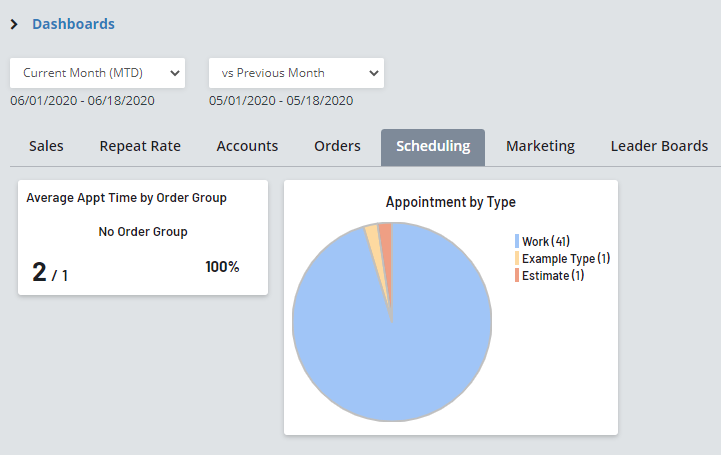
Average Appt. Time by Order Group: The average appointment time by order group.
Appointment by Type: A pie chart where your appointments are divided up by appointment type.
Marketing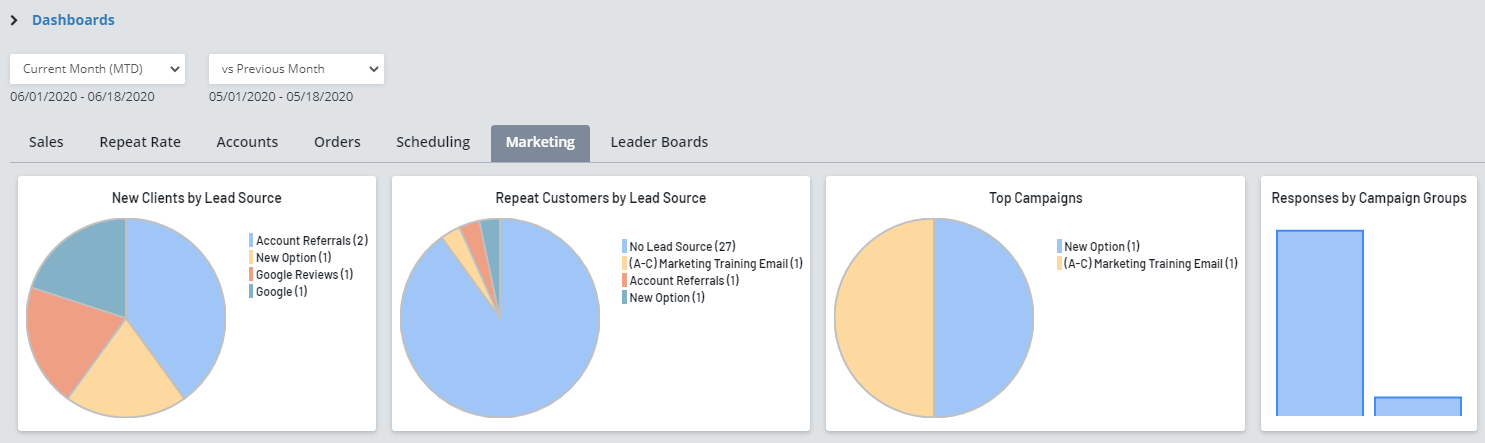
New Clients by Lead Source: A pie chart dividing up your new clients by Lead Source.
Repeat Customers by Lead Source: A pie chart dividing your repeat customers by lead source.
Top Campaigns: A pie chart showing your top campaigns (which campaigns are used most often as a Lead Source)
Responses by Campaign Groups: Where the X-Axis is the campaign group and the Y-Axis is the number of responses (Times where that campaign was used as a lead source)
Leader Boards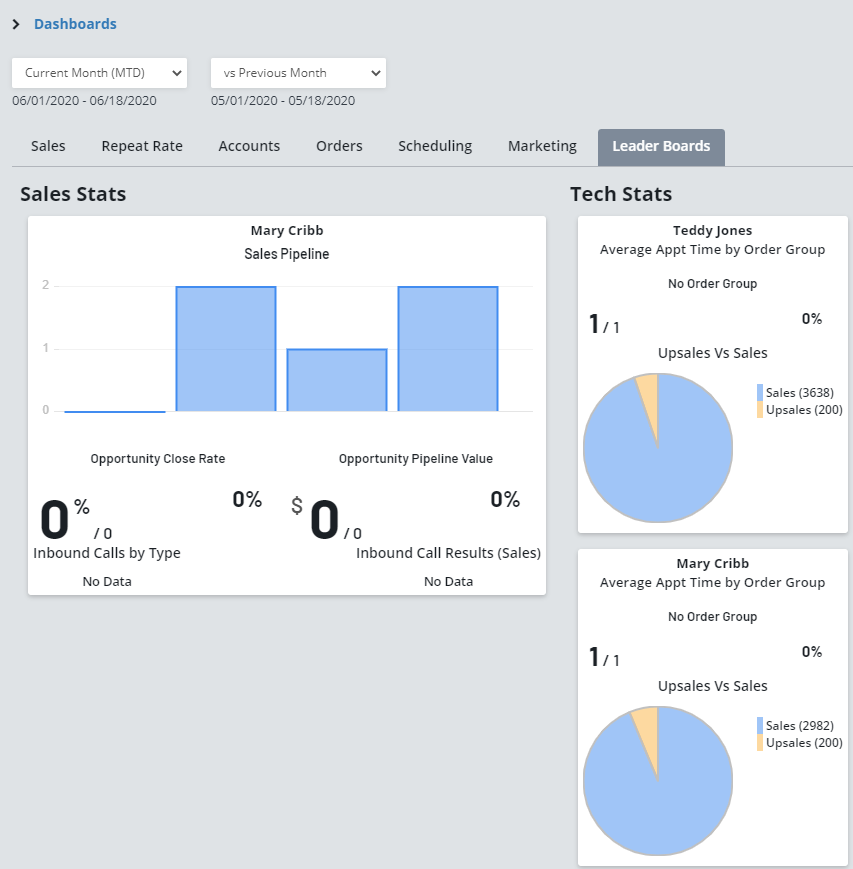
Sales Stats
Sales Pipeline: A bar graph, where the X-Axis is the stage the sales are at (Opportunity, Estimate, Work Order, Invoice), and the Y-Axis is the number of orders.
Opportunity Close Rate: The percentage of opportunities that lead to completed invoices.
Opportunity Pipeline Value: The value of your opportunities on the pipeline.
Inbound Calls by Type: Your inbound calls sorted by type.
Inbound Call Results: Your inbound calls that result in an order being created.
Tech Stats
Here you can see the name of the Tech, and the average appointment time by order group.
Upsales Vs. Sales:
A pie chart of upsales versus sales the tech makes.